So...my usual free tix for these ATL events didn't come thru this time, so I had to stream the game on paramount +... Ok fine, except at precisely 8 pm (which just so happened to be when the game was entering crunch time) the feed switched to f***ing elevator music and some "cannot stream" message. Apparently some jabronie at paramount hadn't figured on a delayed start leading to a delayed finish. Un-f***ing-real, and yes, I'm still pissed.
Anyway, sorry... still not in the mood for any analysis, other than one big thing:
Yes, uk is talented and gifted, but young and loose with the ball. So... for the life of me, I cannot fathom why we would NOT scramble and terrorize them with switching defenses instead of letting them play one-on-one and/or goad us into accepting up-down switches and resulting mismatches. During the 37+ minutes I watched live, we scrambled exactly once and, lo and behold, forced a TO.
I fully support the staff, but this was not one of their better game-plans.
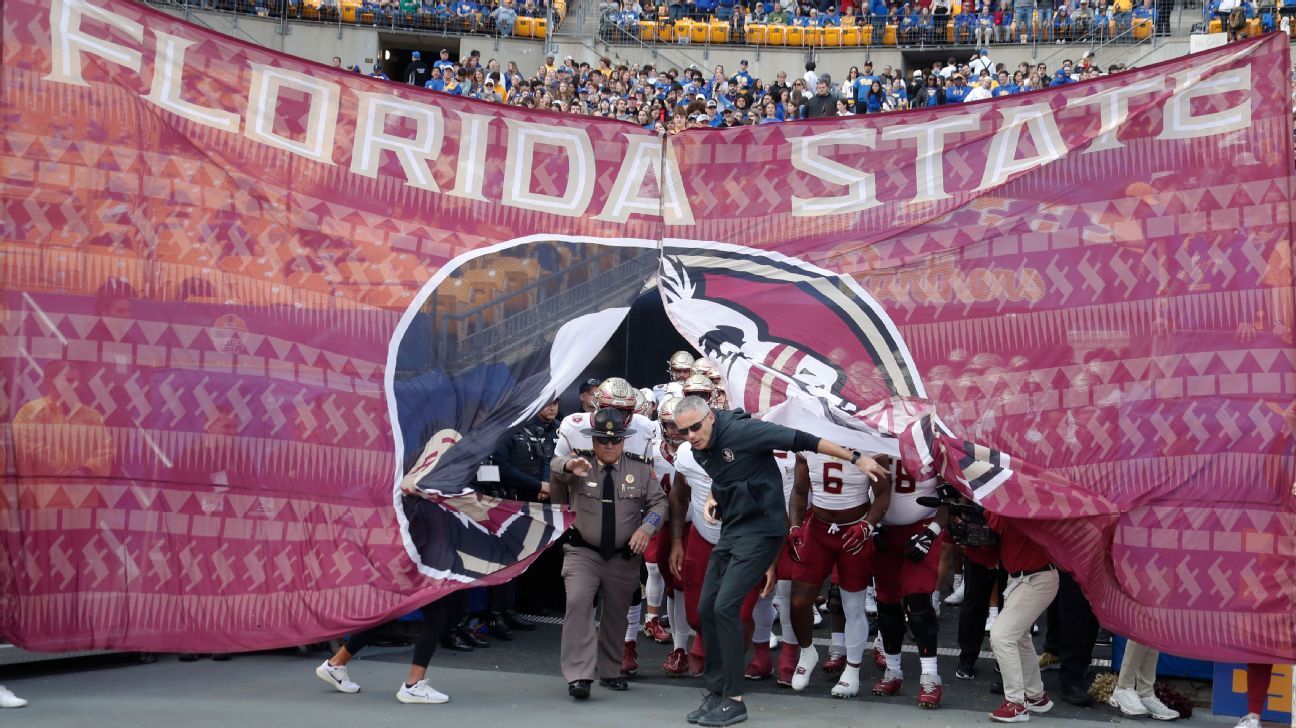
“It’s unfathomable that Florida State, an undefeated Power Five conference champion, was left out of the College Football Playoff. Their exclusion calls into question the selection process and whether the Committee’s own guidelines were followed, including the significant importance of being an undefeated Power Five conference champion. My heart breaks for the talented FSU student-athletes and coaches and their passionate and loyal fans. Florida State deserved better. College football deserved better.”
Florida State is suing the ACC over the league's grant of rights and $130 million withdrawal fee, becoming the first school to challenge a grant of rights in court.
STAT = Statistic being reported
VALUE = Value of reported stat from the current game
PCTLE = Percentile When Compared to All UNC Games since 1996
Historical Comparison = Graphic Portrayal of PCTLE. Marks depict 20% quintiles, as well as 50%.
FG% = UNC Total Field Goal Percentage (47.0% avg since 1996)
3FG% = UNC 3-point Field Goal Percentage (35.6%)
2FG% = UNC 2-point Field Goal Percentage (51.4%)
FT% = UNC Free Throw Percentage (70.0%)
fg% = Opponent Total Field Goal Percentage (41.6%)
3fg% = Opponent 3-point Field Goal Percentage (33.8%)
2fg% = Opponent 2-point Field Goal Percentage (45.9%)
ft% = Opponent Free Throw Percentage (68.2%)
PTS/POSS = UNC Points Per Possession (Smith Method, 0.934)
pts/poss = Opponent Points Per Possession (Smith Method, 0.846))
POSS = UNC Total Possessions (Smith Method, 85.6)
POSDIF = UNC Advantage in Total Possessions (Smith Method, 2.03)
%LOB = UNC Percentage Loss of Ball (TO/POSS, 15.9)
%lob = Opponent Percentage Loss of Ball (to/poss, 16.4)
MOV = Margin of Victory (9.43)
%FROM3 = UNC Percentage of FG Attempts Taken From 3 (35.6%)
AST/POSS = UNC Assists Per Possession (Smith Method, 0.20)
AST/FG = UNC Assists Per Field Goal (0.59)
AST/TO = UNC Assists Per Turnover (1.4)
OR% = UNC Percentage of Missed Shots that are Rebounded (0.344)
%from3 = Opponent Percentage of Shots Taken From 3 (33.8)
ast/poss = Opponent Assists Per Possession (Smith Method, 0.16)
ast/fg = Opponent Assists Per Field Goal (0.52)
ast/to = Opponent Assists Per Turnover (1.1)
or% = Opponent Percentage of Missed Shots that are Rebounded (0.241)
poss = Opponents Total Possessions (Smith Method) (83.6)
TOTPOSS = Total Possessions in the Game(Smith Method, 169.3)
SmithIdx = UNC Total of Pts/Poss minus Offensive Goal (0.95) + Defensive Goal (0.85) minus Opponent Pts/Poss (avg: -0.01)
Discussion
The Heels entered a "neutral site" (Charlotte) to face #7 Oklahoma for the first time since the Regional Finals in 2009 where the Heels ended the college career of Blake Griffin.
UNC had, perhaps, its most solid game this season, playing mostly 7 players, and building chemistry among those 7. Withers only tallied 4 minutes in this game, Washington was only used 5 minutes, while High was used 12 minutes, interestingly.
The Heels scored 1.00 pts per possession while keeping Oklahoma at 0.80. It's the 286th most sound beating of a team in the last 1001 games. UNC forced Oklahoma to turn it over on 21% of its possessions, a feat only seen 180 times in the last 1001 games.
Despite those gaps, Oklahoma still had a chance in the final 5 minutes. That's because UNC was, again, atrocious on rebounding. Oklahoma had 5 more possessions than UNC, something we've seen 167 times in the last 1001 games.
UNC shot 41% from the field after a cold start, which really helped. Offensively, though, we only saw 0.11 assists/possession. We've only seen worse 62 times in the last 1001 games. If this team can get to the point where Cadeau is the floor leader and distributor, and the ball touches a big man on every possession, we will see far more consistency and be more immune to cold shooting.
The game had 167 possessions, so the Heels could pick tempo up a bit, actually. Since 1996 we have averaged 169.0 possessions per game, and this team is averaging 167.2. We have not had a team average more than 169 possessions since the 2019 Coby white team that reached the Sweet 16. Since the 2012 Kendall Marshall team, we've only had 2 teams average faster than 169.0; 2017 and 2019. Those teams were led by some top level point guards.
There is only one more game left in 2023, then we get into the meat of the ACC season with Pitt. Funny that after 11 games we still have a lot of question marks. After what we've seen, that means that this team has a lot of potential. The key is Cadeau's development.

 northcarolina.rivals.com